Questions
Suggested Questions were
-
What is the format of the input data
-
What is the data volume
-
What are some of the most important queries to support?
-
Do we need to worry about edge cases? Some potential concerns I have are events that are processed significantly later, duplicated events and possibly system recovery in the event a node goes down.
-
Are there any latency requirements?
Design
Our goal is to design a system which can
- aggregate the number of clicks of
ad_idin the lastMminutes - return the top 100 most clicked
ad_ids every minute - support aggregation filtering by different attributes
Aggregation data will also be used for RTB and ads billing so it is important for it to be correct.
High Level
We can have two main APIs to support our use cases
GET/v1/ads/{:ad_id}/aggregated_count: This returns an aggregated event count for a given ad_idGET:/v1/ads/popular: This gets the topnads in the lastmminutes/
We can allow users to filter by different filters - Eg. Country, IP type by using query parameters.
Database
Since we’re looking at a large amount of raw data and have a high peak QPS of ~50,000, ideally we want a system that is able to support a write-heavy workload. We’d only be using raw-data for recalculation and backup so read-volumes are not high.
It is difficult to scale up the write for relational databases, hence it is more suitable to use something like Cassandra and InfluxDB which is optimised for write and time-range queries.
Aggregation Service
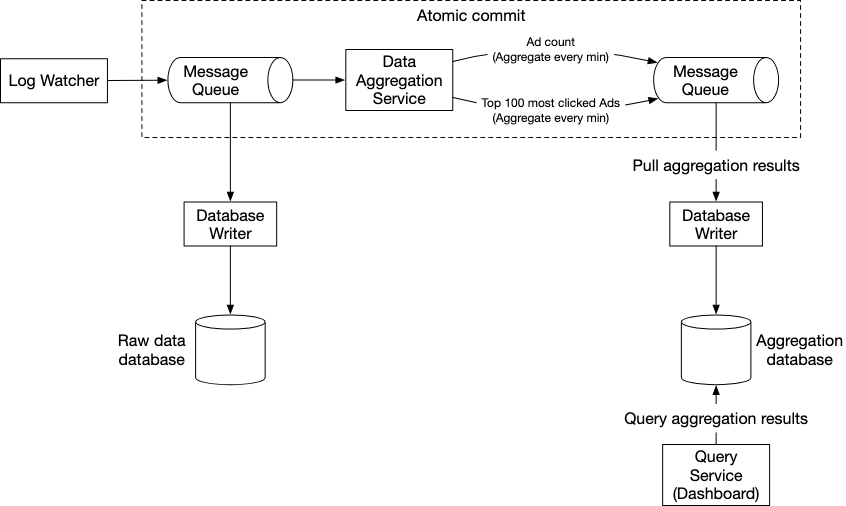
In order to ensure that we have exactly once commits to our database, we utilise a message queue in between our data aggregation service and the database writer.
The initial message queue will contain ad click data by ad_id, timestamp, user_id, ip, country which corresponds to the raw data input format.
The second message format will contain two types of values
- Ad Click Counts : Aggregated a per-minute granularity.
- Top N clicked ads aggregated at per-minute granularity
We utilise the star schema method whereby we pre-define filtering criteria and aggregate based on them.
| ad_id | click_minute | country | count |
|---|---|---|---|
| ad001 | 202101010001 | USA | 100 |
| ad001 | 202101010001 | GPB | 200 |
| ad001 | 202101010001 | others | 3000 |
| ad002 | 202101010001 | USA | 10 |
| ad002 | 202101010001 | GPB | 25 |
| ad002 | 202101010001 | others | 12 |
Watermark
We can process the data for a window slightly after it has happened to allow for some degree of leeway for events.
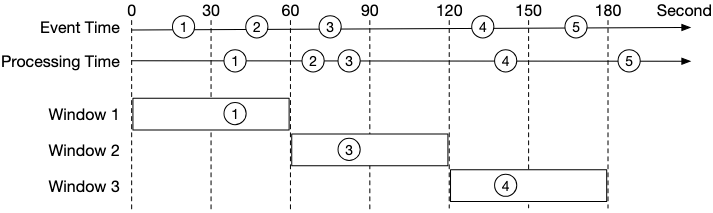
This is dependent on the business requirement since a long watermark catches late events but also increases system latency.
Deduplication
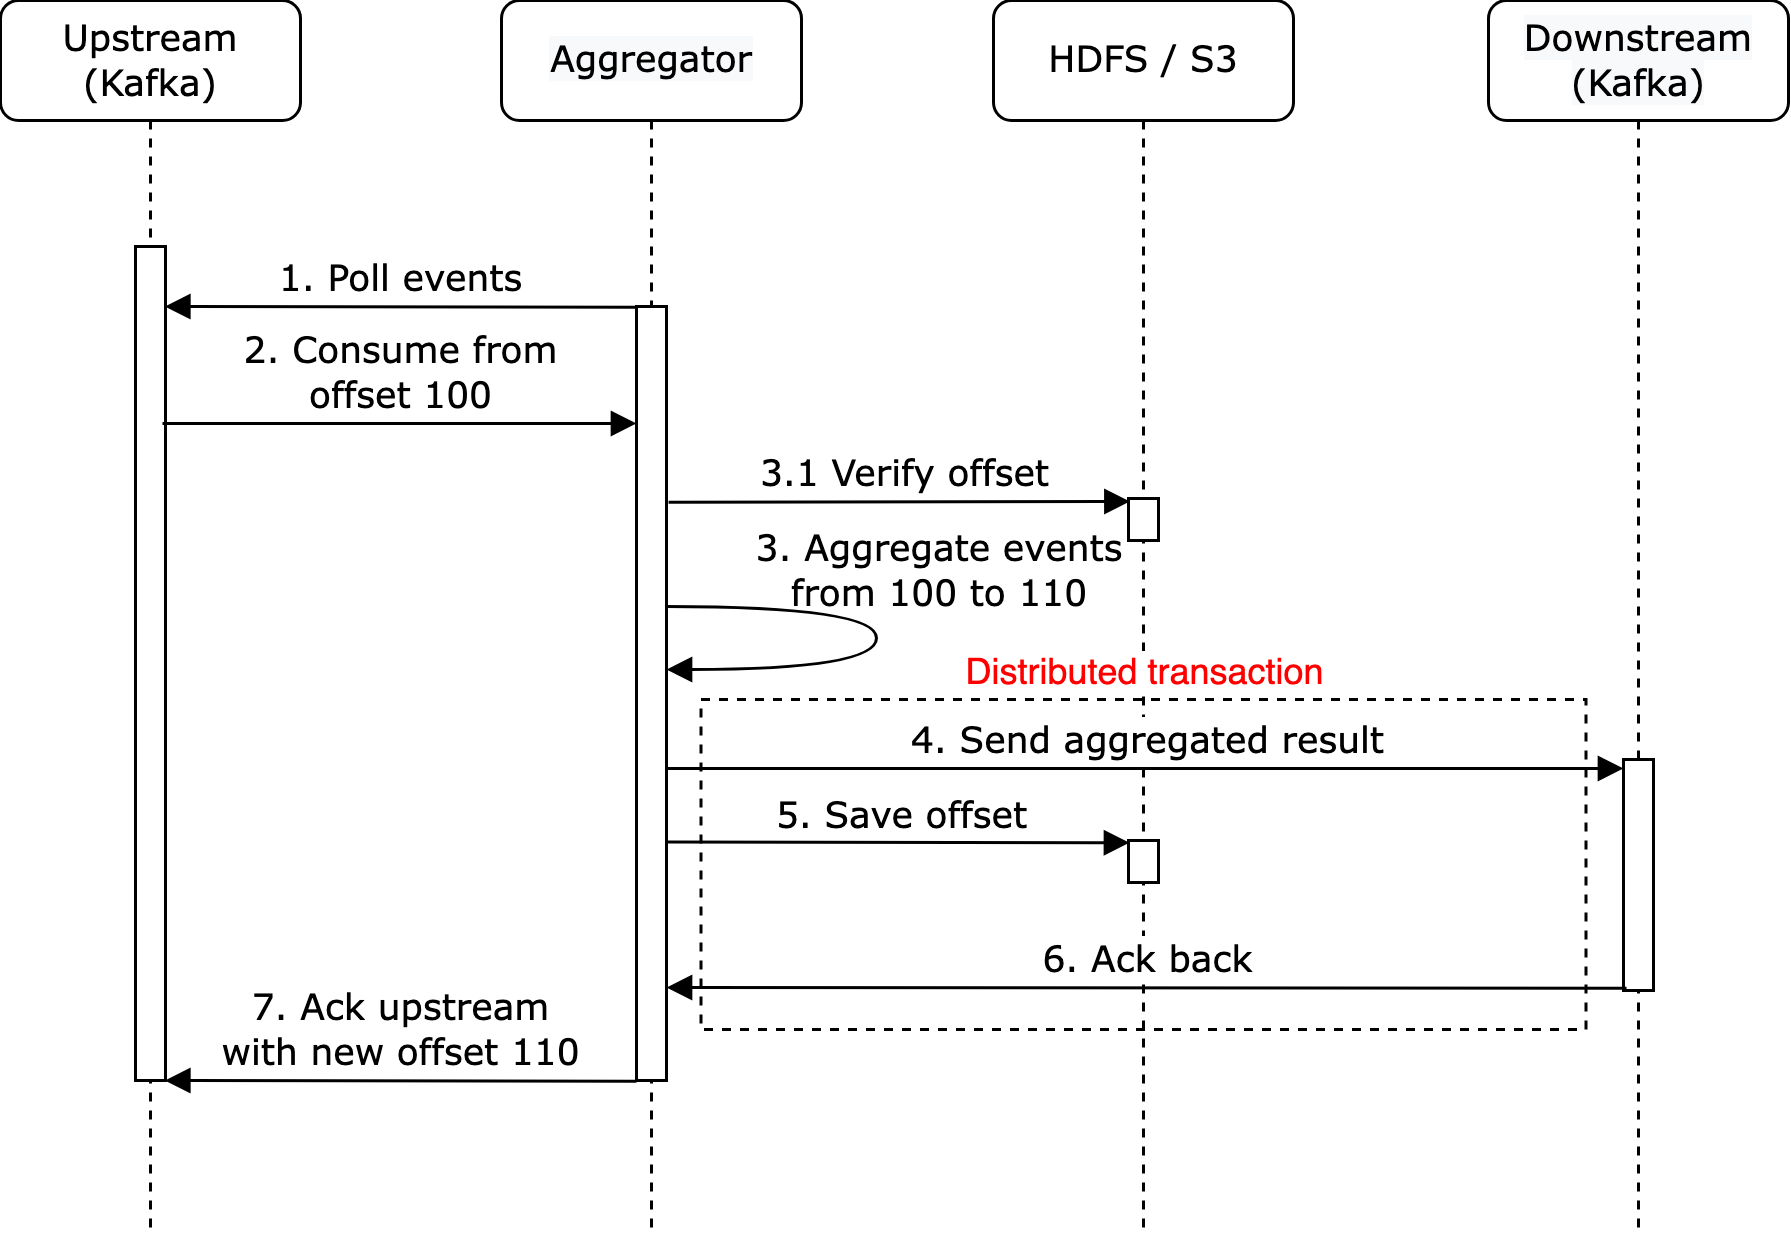
To prevent our nodes from sending in multiple transactions, we need to utilise a single distributed transaction which rolls back a transaction if any of the events fail.
Note the use of a HDFS and S3 to backup our previously saved offsets.
Scaling
In the event that our system needs to scale, we can perform scaling in the following areas
- Cassandra natively supports scaling and will rebalance partitions when a new node is added
- A Resource manager can be used in our map-reduce node cluster to allow for nodes to apply for extra resources. This resource manage can allocate more resources to prevent nodes from being overloaded.
Recalculation Service
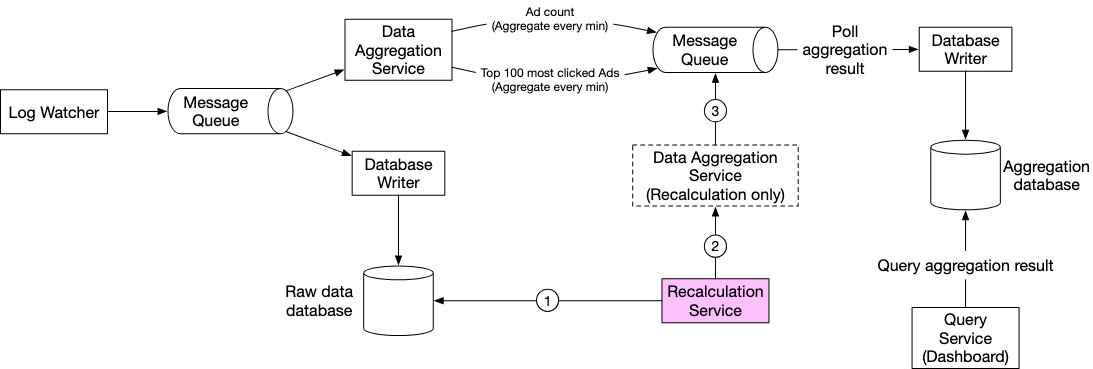
We can also take advantage of our raw data to perform a aggregation service at the end of day to ensure we have aggregated the values correctly.
This can be structured as a batch job.
Concepts
Aggregation
Since the volume of data is very large, we cannot possibly allow users to run custom filters that we don’t support. As a result, we can aggregate data using its ad_id, timestamp and a specified filtering mechanism that we term filter_id.
| ad_id | timestamp | filter_id | count |
|---|---|---|---|
| 001 | timestamp | 0012 | 2 |
By doing this, users can easily filter out their chosen results by filtering from this table. We can store the raw data for debugging in the event that we need to do some sort of comparison but having this aggregated data is important to ensure fast lookups.
Map Reduce
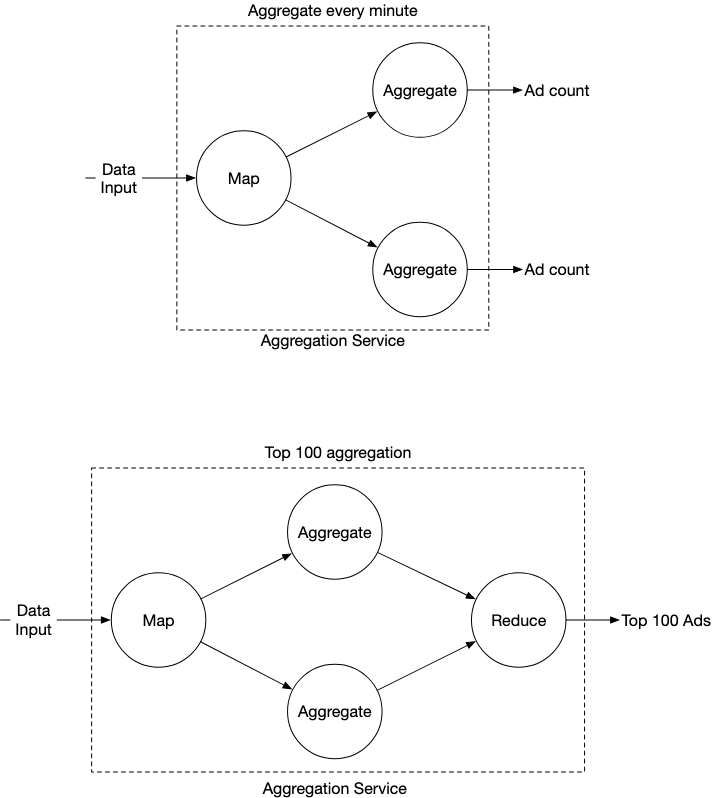
Since the data volume is large, we’d want to use something like a map reduce. Each node is responsible for one single task and it sends the processing result to downstream nodes.
This is represented using a directed acyclic graph (DAG). We have the following type of nodes
- Map node : Reads and transforms data
- Aggregate Node: Counts ad click events by ad_id in memory
- Reduce node : Reduces aggregated results from the aggregate nodes into a final result (Eg.
Nmost clicked ads in the last minute)
This helps to take large data chunks and use parallel distributed computing to turn big data into little or regular sized data chunks.
Failover
Ideally, we save snapshots of the node at different time steps. This means that whenever our node goes down, we simply recover the node from the snapshot rather than replay the kafka event from a certain point - which might be costly and expensive to do at high volume periods.
Timestamp
We need to choose a timestamp to perform aggregation - there are two potential areas to chose from.
- Event Time : When an ad click happens
- Processing Time: The system time of the server when it processes the click event
Since we are using a distributed form of architecture, we ideally want to account for the fact that the gap between event time and processing time can be quite large.
Hence, it is better to use event time in this case.