Questions
These were the suggested questions
- Who are we building the system for? Are we building an in-house system for a large corporation like Facebook or Google or are we designing a SAAS service like Datadog or Splunk
- Which metrics do we want to collect?
- What is the scale of the infrastructure that we need to monitor with this system
- How long should we keep the data for?
- Can we reduce the resolution of metrics data for long-term storage?
- What are the supported alert channels?
- Do we need to support distributed system tracing?
Design
Our system needs to have the following 5 features
- Data collection : Collecting metric data from different sources
- Data Transmission : Transfer data from sources to the metrics monitoring system
- Data storage: Organise and store incoming data
- Alerting : Analyse incoming data and generate alerts. This must be able to send alerts to different communication channels
- Visualisation: Be able to present data in graphs, charts etc
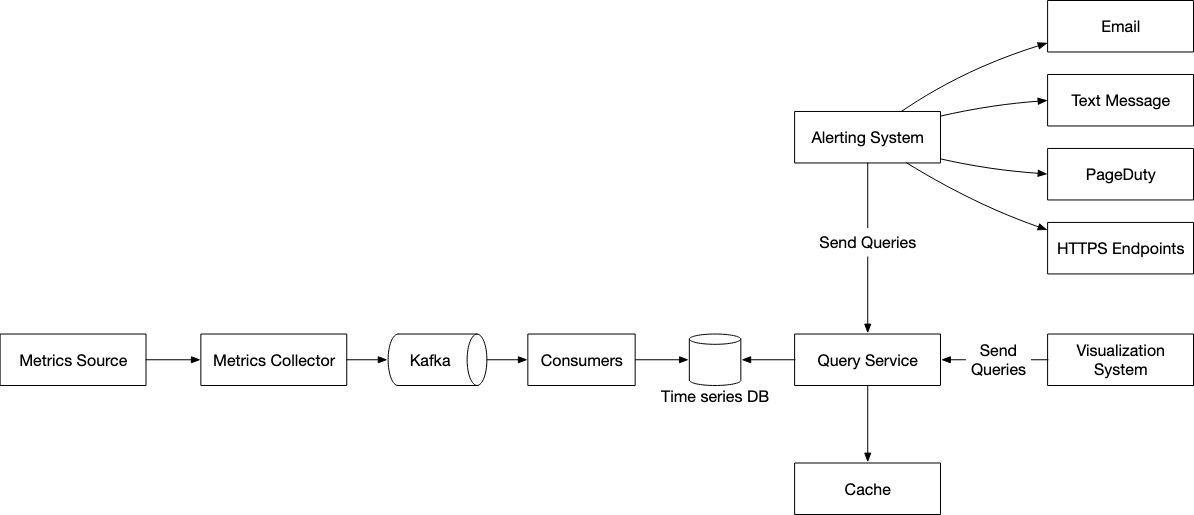
This is the high level overview of the design
Database
Ideally, since most of our querying will involve some form of time series data, it’s not wise for us to rely on using a NoSQL or relational database. This is because of the following reasons
- Relational databases are not optimised for operations to be performed against time-series data
- NoSQL databases would require a separate schema and a lot of tuning to be able to effectively store and query time-series data
On the other hand, we have strong competitors in the market that provide robust solutions for time-series. Therefore, it would be wise to use something like InfluxDB or Prometheus which are designed to store large volumes of time-series data and perform real-time analysis on data.
For context, a Influx DB with 8 cores and 32 GB of ram can handle over 250,000 writes per second. Which is more than our expected QPS
Compression
Over time, in order to save on storage costs, we’d want to downsample. This means that we want to aggregate the data that we collected.
For instance, if we had 3 datapoints that were 10:00,10:10, 10:20,10:30. We could aggregate them all together into a single 30s window by taking their average.
Optimizations
We can also throw infrequently accessed data into cold storage. This form of data is significantly cheaper to us.
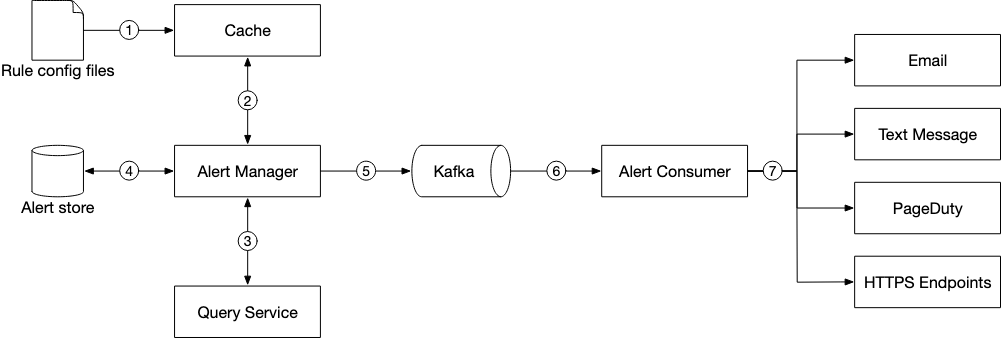
Alerts
We utilise two main things in the design below
-
Kafka : This is a buffer between the alert manager and the alert consumers and ensures that our alert system doesn’t get overwhelmed in a period of high traffic
-
Cache : We use a cache so that we can read in the various different configurations at a higher speed. This is because in-memory access is always much faster than disk-based acccess.
-
Alert Store : This is a key-value database that keeps the state of all alerts. it ensures that all alerts are sent at least-once.
Data Collection
We have two main options available for data collection - Push or Pull. On a high level, we’d want to also put in a buffer between our metrics collectors and the consumers that help update our time series DB.

Kafka
By using a queueing system like Kafka, we can take advantage of the decoupling between the consumers and metrics collectors. We also can prevent data loss when the database is unavaliable.
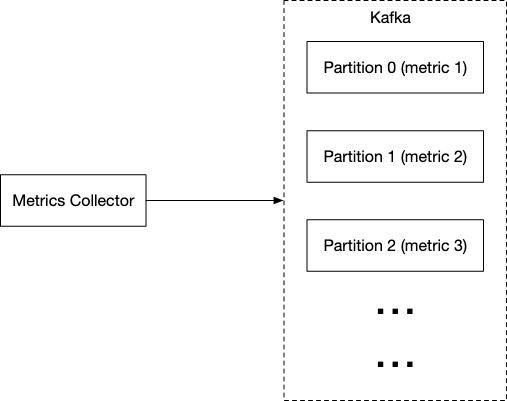
Ideally, we’d also want to have some form of partition using topics so that our consumers can consume and aggregate metrics more easily. This also allows us to scale up and down certain portions of the system if load increases.
Pull Mechanism
If we opt for a pull mechanism, then we should use a collection of servers with consistent hashing to ensure each collecter handles a single service and we don’t have duplicate messages.
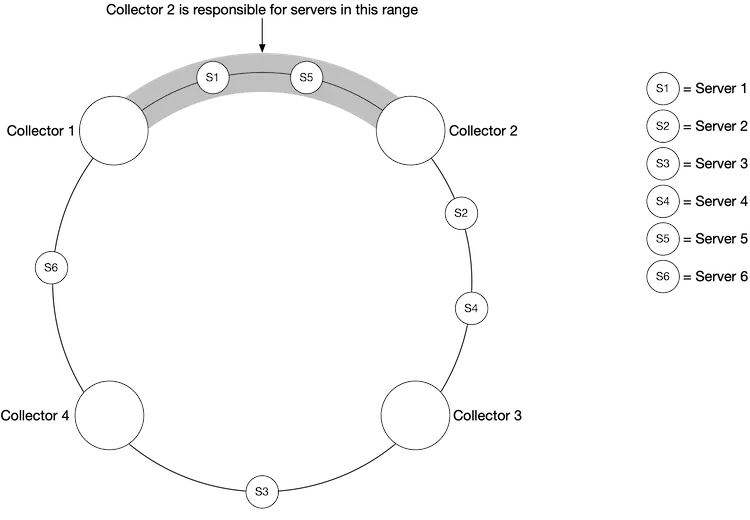
A key benefit of the pull mechanism is that our servers are unlikely to be overwhelmed. However, it also requires that every single endpoint that we need to hit is reachable by our server, this might be an issue in multiple data center setups.
We’d also need to manually define the configuration files for each service that we want to pull from in order to start pulling from these data sources.
Push Mechanism
If we are using a push mechanism, then our servers will be making a POST request to the metrics collector. In such a case, it’s wise to have a distributed queue like Kafka in front of the metrics collector to help prevent the metrics collector from being overwhelmed.

However, opting for a push mechanism means that we also need to set up a collection engine on each of the monitored servers. This adds additional complexity but also gives us the option of being able to batch the updates that are being sent over to the load balancer.
A Push mechanism might also be better for something like serverless since it allows us to capture logs from short lived functions that will not be reachable after their execution.
Query Service
We also need a query service which can access the time series database and handle requests from the visualisation or alerting systems. This dedicated set of query servers decouples time-series databases from the clients.
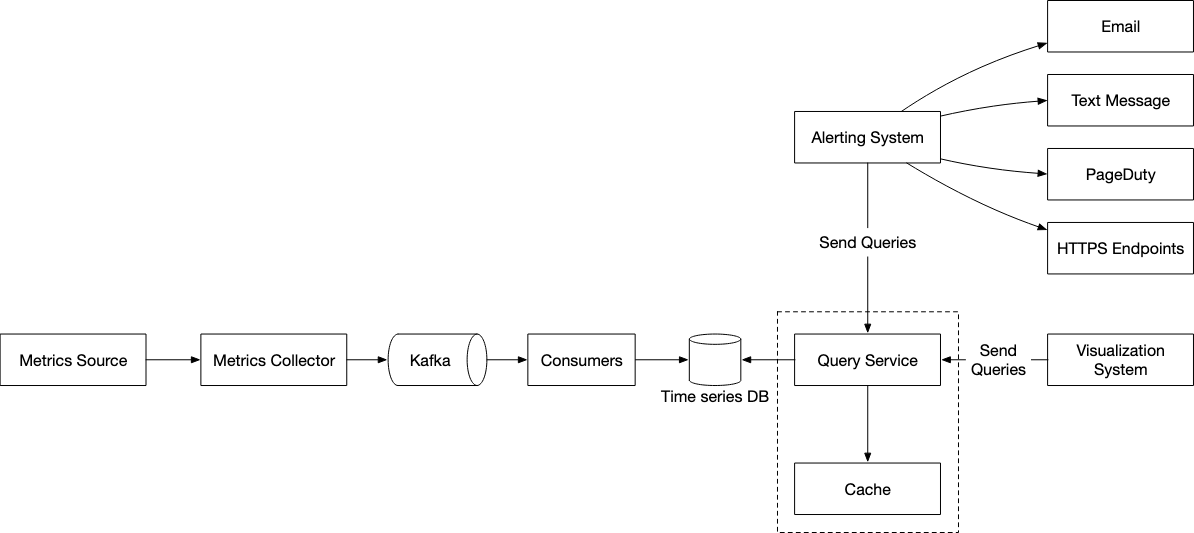 We also take advantage of a cache to reduce the load on the time-series database and make our query service more performant.
Concepts
Querying
Metrics data is going to be a time series that contains a set of values with associated timestamps. This series itself can be uniquely identified by name and optionally by a set of labels.
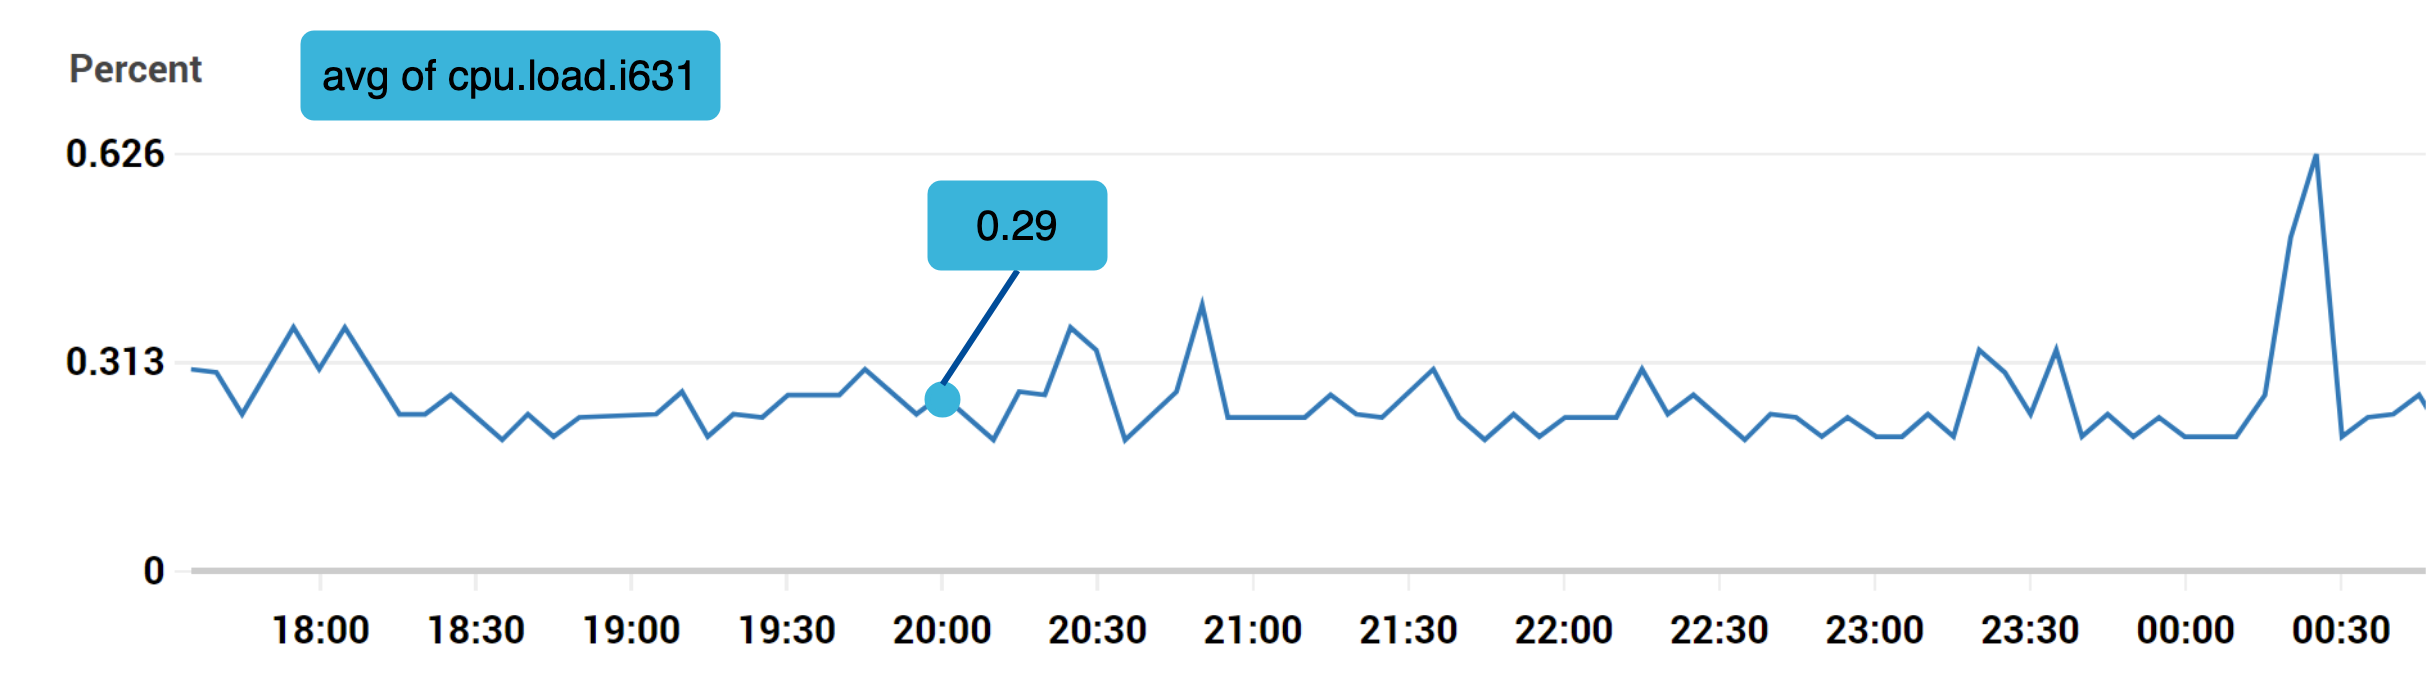
Typically we’d use a specialised line format to load the data
CPU.load host=webserver01,region=us-west 1613707265 76
CPU.load host=webserver01,region=us-west 1613707265 83
Note that it’s generated according to
metric_name tags values
Where multiple values in a single component are joined by ,